OVERVIEW

Steward

CATEGORY/ SELECTED WORKS

YEAR/ 2025

CLIENT/

Status/Completed

Project Duratıon/5 Weeks

Industry/Clean Beauty, Cosmetics

Deliverables/Instagram templates, Reels opener kit, highlights icons, story tone guide, TikTok frames

Launch Date/May 2025

Turn every pour into precision - STEWARD transforms liquor inventory into a passive, data-driven system that cuts wastage, prevents pilferage and preserves flow without disrupting the bar.

Overview

//Problem Statement


Bars lose significant revenue due to liquor wastage - not just from theft, but because current inventory systems fail to capture real-time pouring, creating gaps between recorded data and actual usage.


#Solution

STEWARD transforms liquor inventory into a seamless, data-driven system through a smart pour spout that passively measures and audits every pour.

Designed to fit naturally into bartender workflows without disrupting service or trust.


Photo 3
Photo 4

Impact


In development testing at one bar station, we saw an estimated ~20% reduction in inventory-related losses (including overpouring). These are early results from a limited setup; expanded beta across more stations and locations is in progress to validate performance at scale.

Job Role & Project Timeline


ROLE


Product Designer


Research, Systems Thinking &

Early Concept Development


PART-A Timeline


2nd Dec 2024 - 31st Dec 2024

Design Process

Double Diamond-Iterative Process

Research Empathy Systems Thinking Data-Driven User-Centered

Case Study

I. Discover

A client approached us after observing persistent liquor wastage and unexplained inventory shrinkage across shifts. While theft was suspected, there was no concrete evidence to validate or disprove it. Existing inventory records were manual, retrospective and inconsistent, making it impossible to distinguish between intentional misuse, unintentional overpouring or systemic inefficiencies.


Rather than asking for a predefined solution, the client proposed a research study to understand​ why liquor loss was occurring and whether an intervention could meaningfully reduce wastage without disrupting bar operations. Also the client assumed if we find a feasible solution, it could become a good business opportunity.

INITIAL HYPOTHESIS (Client Perspective)

Liquor wastage was higher than
acceptable margins

Some loss could be attributed to
theft or misuse

Better visibility into pouring behavior
might reduce shrinkage

However, the mechanism, scale and root causes of the problem were unknown...

RESEARCH PROBLEM STATEMENT

“Bars and pubs experience alcohol loss, but lack clarity on when, where and why this loss occurs. This
research aims to understand existing alcohol handling practices, record-keeping behaviors and
breakdown points across people, processes and environments.”

WHAT DID I UNDERSTAND FROM THIS

FRAMING THE 5W’s & 1H

Who
Who is affected by liquor wastage? Who handles inventory?
What
What types of loss occur? What are existing tracking methods? What does "acceptable shrinkage" mean?
Where
Why do bartenders overpour? Why do current systems fail?
When
Where does loss happen in the workflow? Where are the blind spots in current monitoring?
Why
When does overpouring peak? When are inventory checks done? When is loss discovered?
How
How do we set up an effective study to get to the root of the problem ?

II. Secondary Research & Literature Review

THE RESEARCH QUESTION GUIDED THE RESEARCH DIRECTION

RESEARCH ACTIVITIES

  • Reviewed bar inventory management workflows and POS systems
  • Studied industry reports, research papers, blogs, videos and articles on bar inventory management, liquor loss and overpouring
KEY FINDINGS
  1. Inventory shrinkage in bars is both widespread and financially significant. Industry estimates place typical liquor shrinkage at approximately 15-25% due to overpouring, spills and unrecorded losses.
  2. Traditional inventory methods - largely manual and retrospective - do not detect losses in real time, leaving managers without timely insight into overpouring or variance patterns.
  3. Industry analysis consistently identifies overpouring and poor portion control as key drivers of liquor cost variance and shrinkage.

III. Primary Research

Disclosure: Some part of the primary research was conducted in Indian (Bangalore) bar contexts due to logistic constraints. This research was validated by the other part of the primary research and entirety of secondary research conducted in US demographic context.

METHODS

  • Conducted Ethnographic(Covert & Overt) study across 8 different bars across Bangalore for 50 hours across 14 shifts
  • Documented free-pour durations, chain pouring and bottle handling
  • In-situ conversations - Interviewed bar owners, managers and bartenders during shifts
  • Reviewed bar inventory management workflows and POS systems
  • Analyzed existing hardware and software-based monitoring tools

WHAT I LOOKED FOR

METHODS

  • Conducted Ethnographic(Covert & Overt) study across 8 different bars across Bangalore for 50 hours across 14 shifts
  • Documented free-pour durations, chain pouring and bottle handling
  • In-situ conversations - Interviewed bar owners, managers and bartenders during shifts
  • Reviewed bar inventory management workflows and POS systems
  • Analyzed existing hardware and software-based monitoring tools

REFRAMING THE PROBLEM

REFRAMING THE PROBLEM

“Research revealed that theft was a symptom, not the root issue. The deeper problem was the absence of a reliable, sustainable inventory system capable of capturing real-world pouring behavior in real time. How can we create a system that captures real-time liquor pours ? What features should such a system have that keeps the interest of all stake holders without leading to a bias.”

IV. Affinity Mapping

To structure insights, I clustered findings through affinity mapping across 5 lenses.​

THE 5 LENSES & THE INSIGHTS

V. User Flows and Persona Prioritization

To structure insights, I clustered findings through affinity mapping across 5 lenses.​

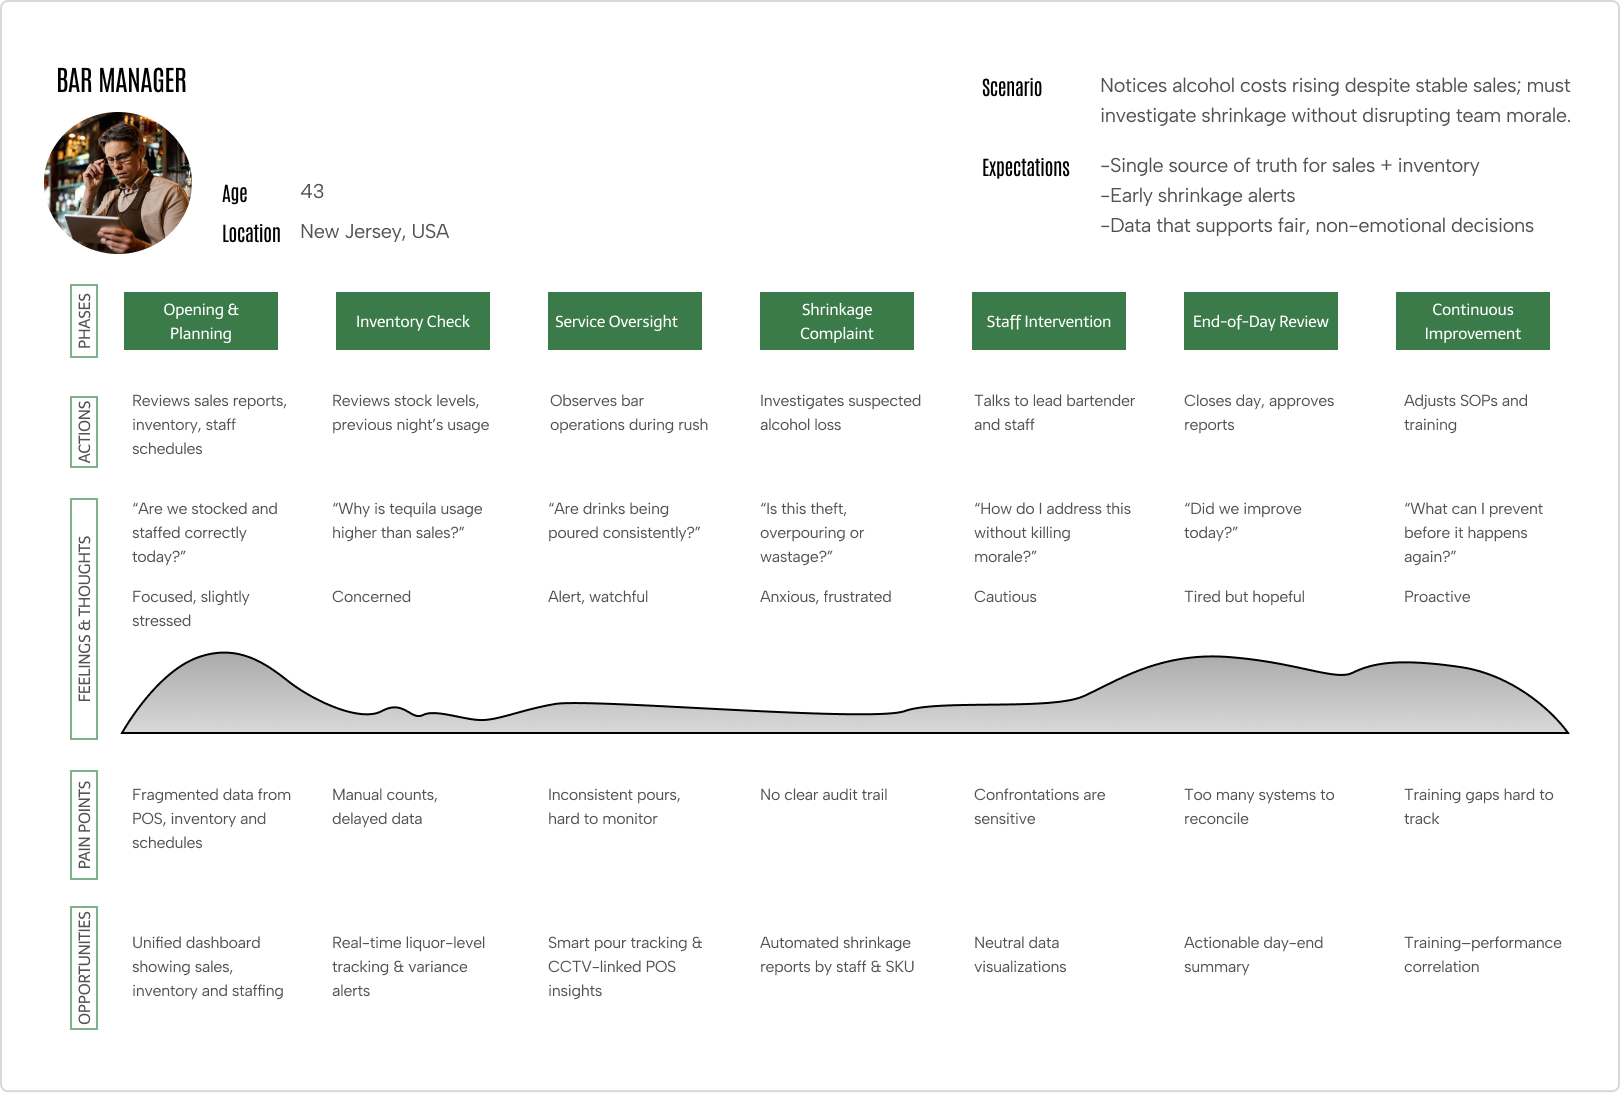
The bar manager navigates fragmented data and operational uncertainty throughout the day, seeking a unified, real-time system to monitor inventory, reduce shrinkage and make confident, data-driven decisions without disrupting staff morale.

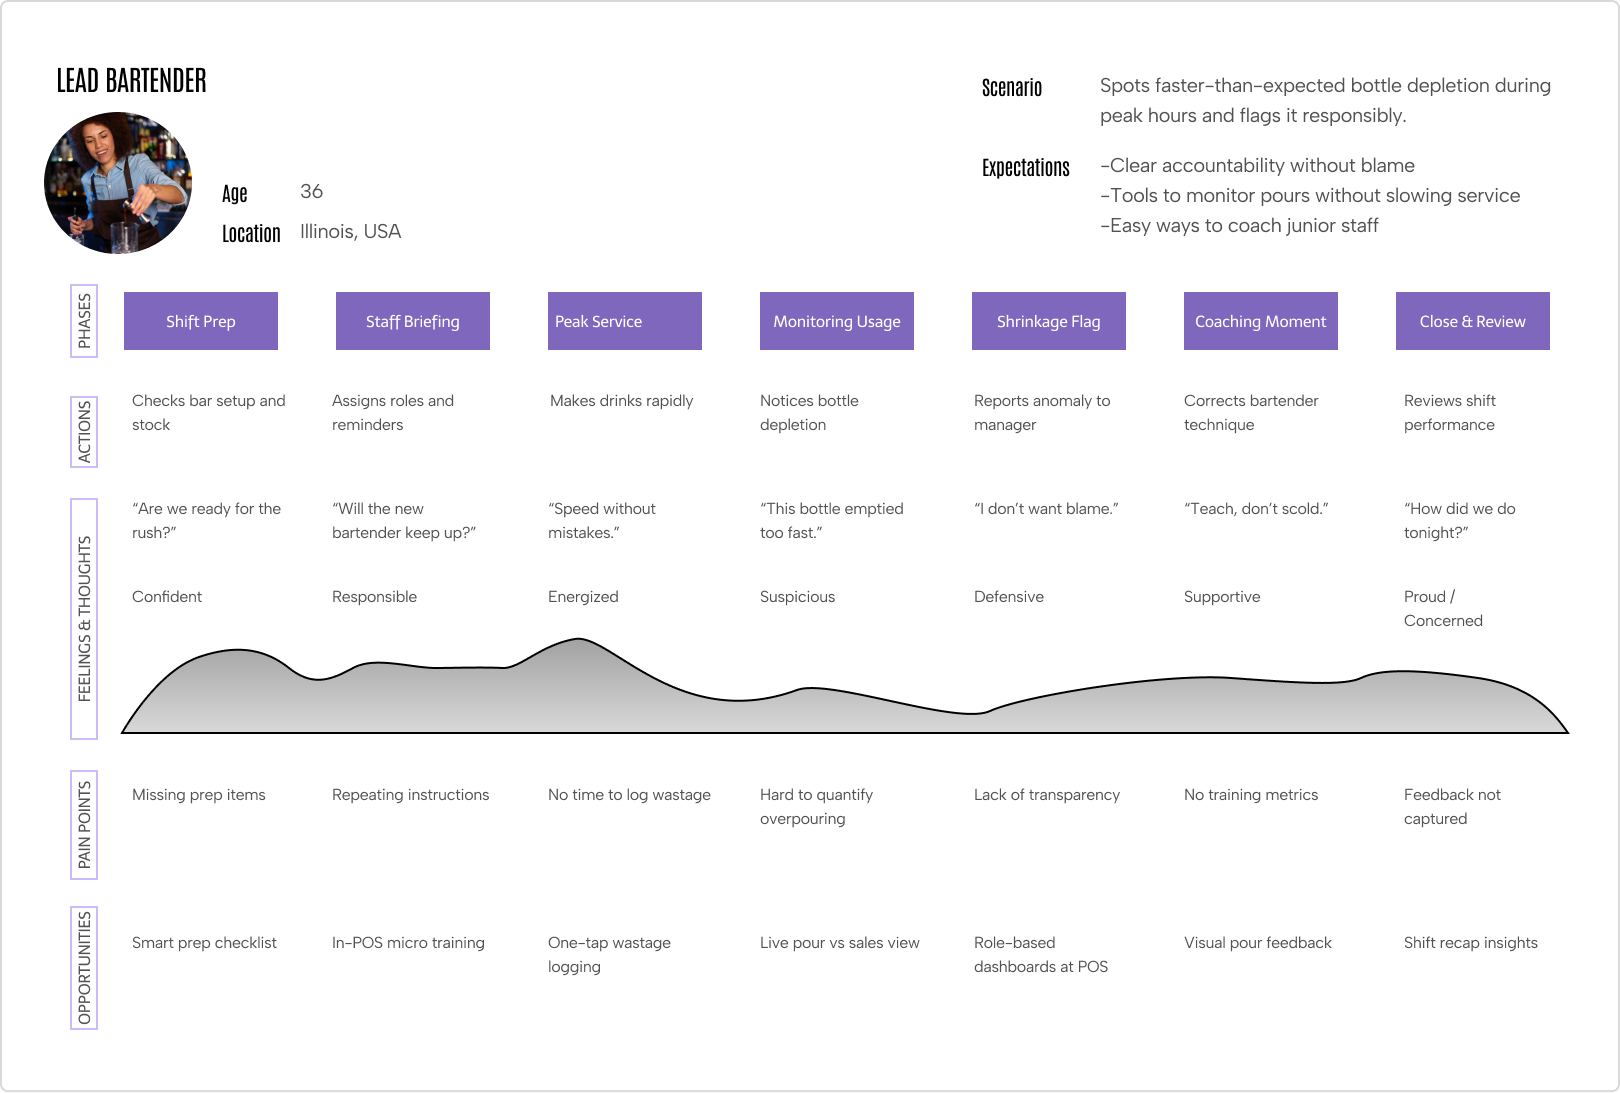
The lead bartender balances speed and accuracy during service while struggling with limited visibility into usage and accountability, needing simple, real-time tools to monitor pours, flag issues and coach staff without disrupting workflow.

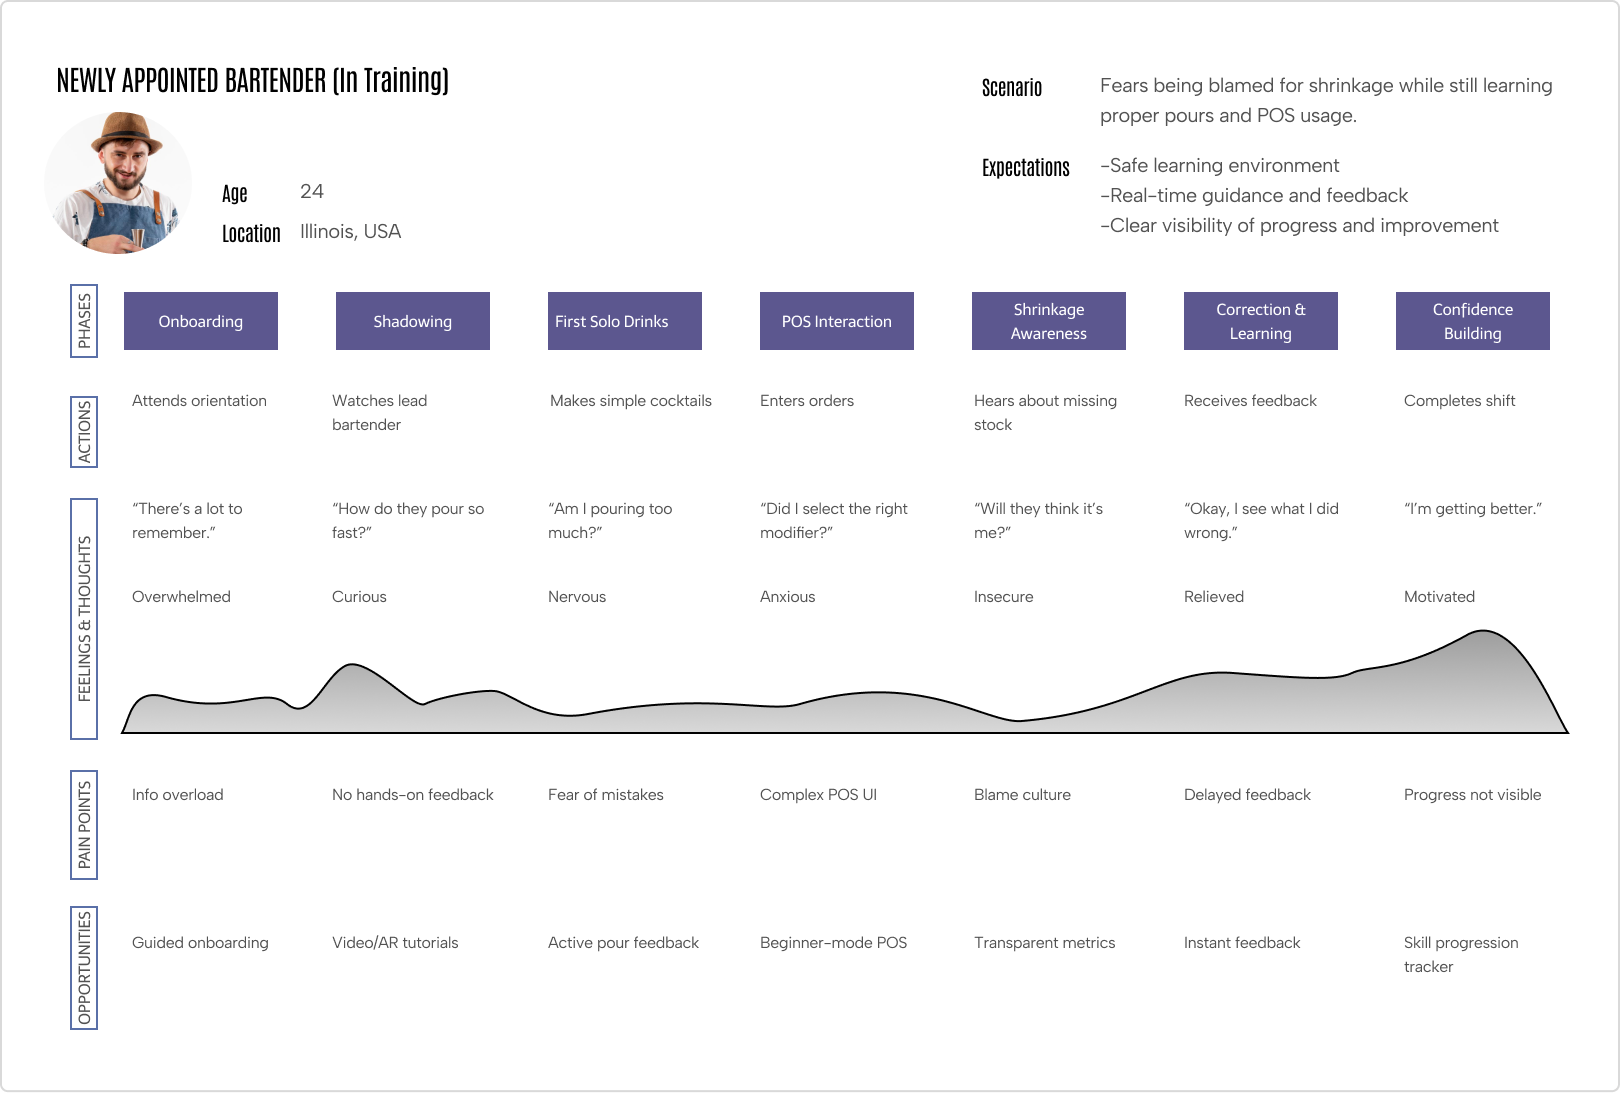
The new bartender in training navigates overwhelm and fear of mistakes, needing guided onboarding, real-time feedback and clear progress visibility to build confidence and avoid blame.

A waiter’s shift journey highlights smooth order flow challenges, communication gaps and stress during complaints and shrinkage, revealing opportunities for clearer modifiers, better visibility and simplified POS processes.

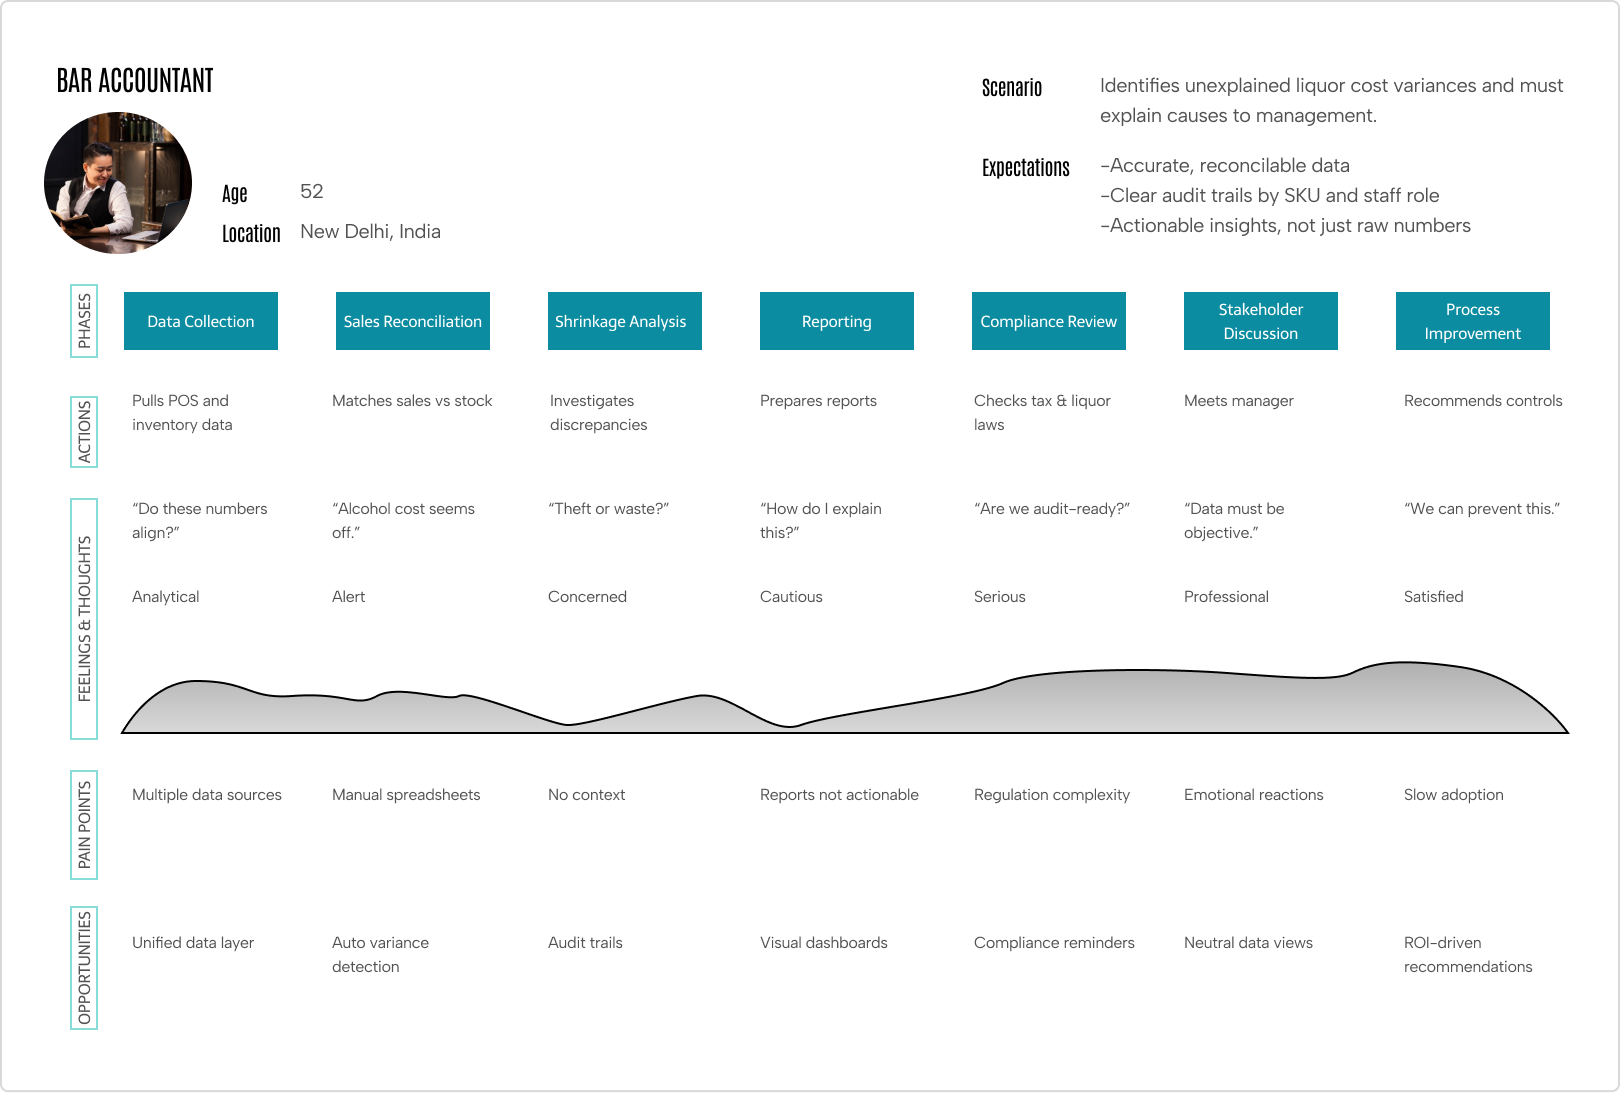
A bar accountant’s journey revolves around reconciling fragmented data and investigating shrinkage, revealing the need for unified systems, clearer audit trails and actionable, compliance-ready insights.

PERSONA PRIORITISATION

Bartender (Lead + Trainee Combined)
Primary
Bartender (Lead + Trainee Combined)
Highest daily interaction with system; biggest direct impact on shrinkage, speed and guest experience.
Bar Manager
Secondary
Bar Manager
Decision-maker and enforcer; uses insights generated from bartender activity.
Bar Accountant
Tertiary
Bar Accountant
Periodic user, validates outcomes and compliance rather than driving daily behaviour.

VI. Brainstorming & Ideation

MARKET RESEARCH

1.

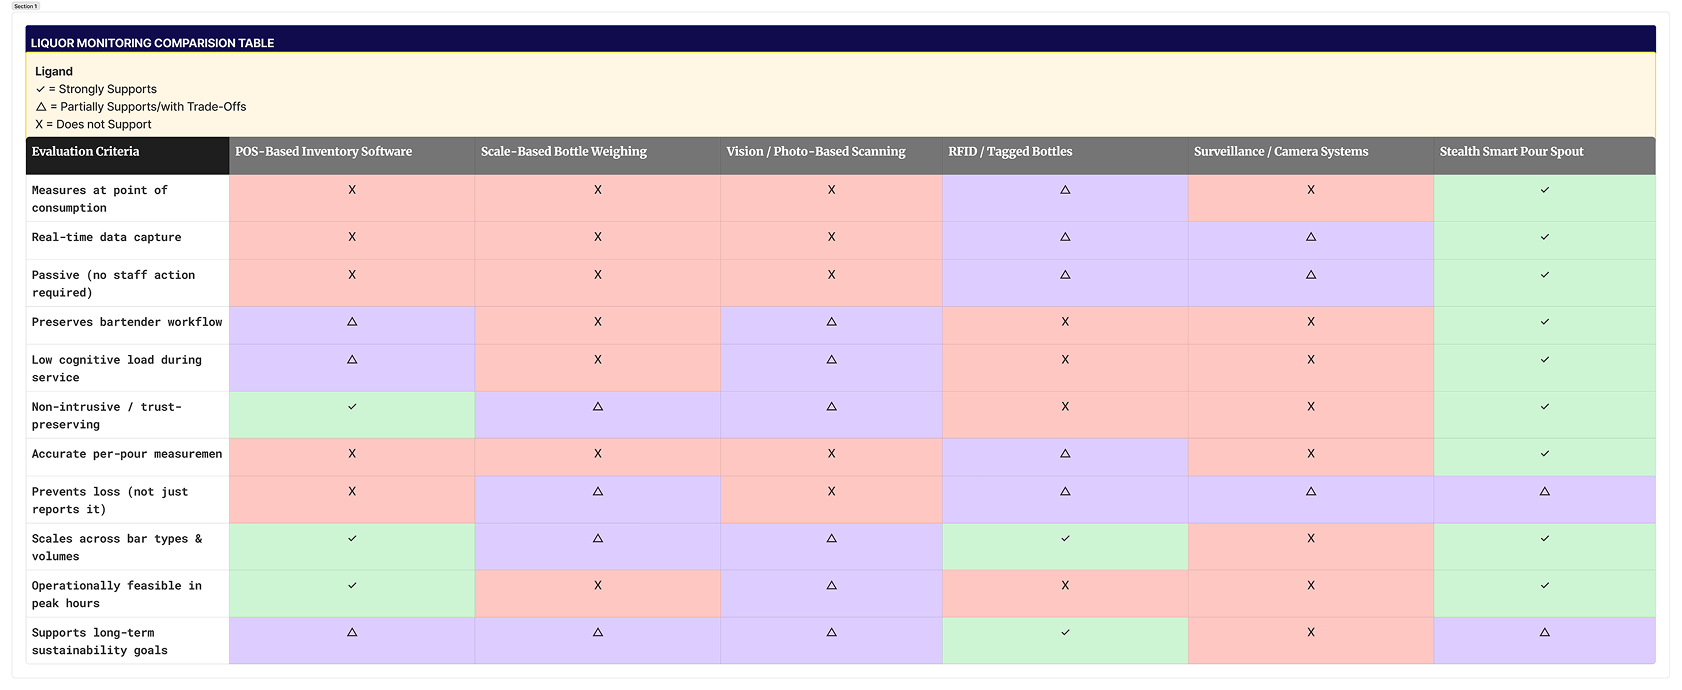
POS-Integrated Inventory Software (Manual Counts, Scanning, Reconciliation)

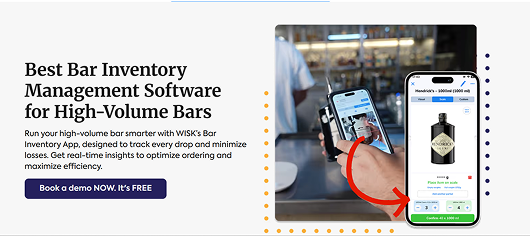
Examples: WISK, Toast Inventory, Restaurant365

Pros

  • Integrates with existing POS and accounting systems
  • Reduces spreadsheet-based errors
  • Improves ordering, forecasting, and reporting
  • Low hardware overhead


Cons

  • Relies on periodic, manual input
  • Detects variance after loss has already occurred
  • Accuracy depends on staff consistency and compliance
  • Provides no insight into how or when loss happens
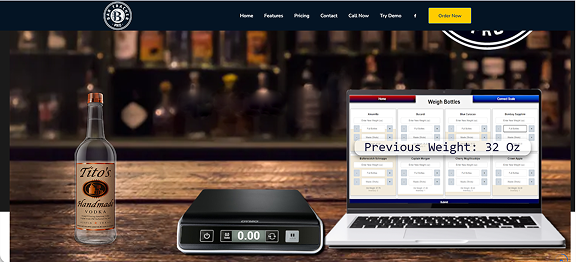
2.

Scale-Based Bottle Weighing Systems

Examples: Bar Cop, Bar-i, Bar Tracker Pro

Pros

  • More accurate than visual estimation
  • Quantifies partial bottle usage
  • Useful for audits and inventory snapshots
  • Hardware-assisted precision


Cons

  • Requires physically handling and weighing bottles
  • Interrupts workflow during busy hours
  • Still periodic, not continuous
  • Does not capture individual pour events
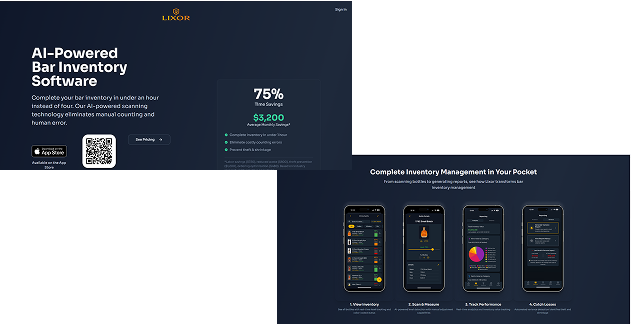
3.

AI / Vision-Based Mobile Scanning

Examples: Liuri, Image-based inventory apps

Pros

  • Minimal hardware requirements
  • Faster than manual counts
  • Easy onboarding (smartphone-based)
  • Lower upfront cost


Cons

  • Dependent on lighting, angles and bottle placement
  • Still requires active staff participation
  • Not real-time, limited to inventory moments
  • Accuracy varies with bottle shape and label visibility
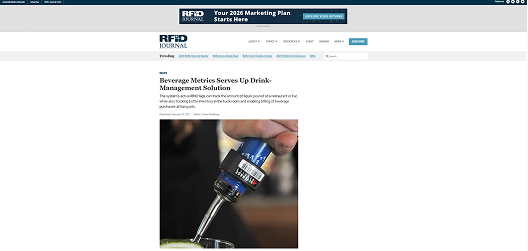
4.

RFID & Tagged Bottle Systems

Examples: Beverage Metrics, early RFID bar systems

Pros

  • Automated identification of bottles
  • Can track movement across locations
  • Strong audit and compliance potential


Cons

  • High setup and maintenance cost
  • Complex infrastructure requirements
  • Limited adoption in real bar environments
  • Poor compatibility with fast-paced service

5.

Surveillance & Camera-Assisted Monitoring)

Examples: CCTV-linked inventory systems, video-assisted audits

Pros

  • High visibility and deterrence
  • Useful for incident review
  • Works independently of POS


Cons

  • Raises privacy and trust concernst
  • Labor-intensive review process
  • No quantitative measurement of pours
  • Actively alters staff behaviour

SOLUTION BENCHMARKING

Comprehensively evaluated existing Bar inventory systems in the market and compared with each other

Stealth Smart Pour Spout clearly outperforms all other solutions by strongly supporting real-time, passive, non-intrusive and accurate per-pour tracking while preserving bartender workflow.

In contrast, other systems rely on trade-offs or manual effort, making StealthPOS the only solution that is both operationally seamless and consistently reliable across key criteria.


Hence a stealth smart pour spout is our proposed solution.

PART B - MATERIAL & SENSOR RESEARCH

Under NDA -  But below are few sharable details...

Photo 2
Photo 3
Photo 4
Photo 5

VII. Final Results

TESTING & VALIDATION

  • ​Built and tested 6 prototype versions of STEWARD.
  • Tested with 4 people total.
  • Validation included 1 bar setting and 3 lab settings.
  • Covered approximately 500 liters of liquid across testing.
  • Early versions achieved ~84% mean continuous-pour accurac
  • Accuracy improved to 98%–99.4% by version 6.
  • Added an accelerometer in later versions alongside the flow sensor to better detect spout position and different pour events.
  • The device supports magnetic charging and runs for up to 10 liters per charge.
  • Data collected is used for pilferage prevention and automated auditing instead of manual check
Photo 1
Photo 2
Photo 3
Photo 4
Photo 5

Thank you!

Filter by
All Projects
Selected Works
Product Design
Academic Learning
Art & Illustrations
Internships
Side Explorations